Ever heard the saying, “Good intentions aren’t enough”?
Master Innovation
Data Doesn’t Have to Be Daunting: A Sneak Peek Inside Acumen Academy's Lean Data Approaches to Measure Social Impact Course
How Acumen Academy's Lean Data course can help you affordably collect high quality data on social performance, customer feedback, and customer behavior.
February 25, 2019

If you’re a social entrepreneur or work at a nonprofit, you know that impact measurement is important - collecting feedback and data helps you understand if your work is catalyzing real outcomes and the change you hope for.
But it’s also likely that the term makes you cringe. Traditionally, the practice is lengthy, expensive, and typically not directly tied to improving the user experience. That said, how can you be sure the efforts you pour into your work are generating the social and environmental impacts you hope for?
After years of working with social enterprises, Acumen developed a simpler approach to measuring social impact to address this question: Lean Data.
About Lean Data
The goal of Lean Data is to better understand the impact of a purpose-driven organization through data collection and analysis. This process serves to provide actionable insights that can be used to directly improve customers’ experience and more effectively drive systemic change.
Lean Data is suitable to any organization that operates in a dynamic environment or faces financial constraints - no long time horizons or expensive resources required.
ACUMEN’S CHIEF INNOVATION OFFICER, SASHA DICHTER, SHARES MORE ABOUT HOW THE LEAN DATA CONCEPT DEVELOPED AT THE 2015 ACUMEN PARTNER GATHERING:
Close
Collecting data to illustrate impact is required for more than simply appeasing funders; impact data is a critical tool for responsible leadership. Strategic decisions grounded in real figures allow you to unlock solutions that create long-term, meaningful change.
Here are a few discoveries Acumen has brought to light during past Lean Data projects:
- Only 57% of customers started using a product within the last 12 months when the company thought 95% of customers had.
- Only 20% of customers were earning less than $5.00 per day, when the company thought 40% of their customers were.
- Initially it was thought 88% of an enterprise’s customers were male, when in fact only 70% of their customers were.
Who Benefits From Learning the Lean Data Method
Lean Data was designed specifically for social entrepreneurs and non-profit managers who want to implement more rapid, lightweight ways of understanding their customers and assessing their social impact. It’s not going to be the best fit for those who have access to the time and budget required to run randomized control trials or other rigorous, long-term evaluation studies.
The Lean Data method is both customer-centered and workable for entrepreneurs. Since it’s optimized for the day-to-day realities of running a social business, the process balances research rigor with speed, cost, and the ability to adjust quickly.
After completing our course, one participant shared, “I previously had no experience in collecting lean data but now I’m really excited to get started. It will help us to understand our organisation better, serve our community more effectively, and build a more insightful relationship with our funders.”
If learning how to collect new insights to make better decisions sounds like a beneficial skill for your work, this course is for you.
Gathering tangible information to guide your next steps doesn’t need to cost thousands of dollars and take years to implement. In just five weeks, this course helps you understand the mindsets and approach behind Lean Data, gain inspiration from companies that have used Lean Data to advance their impact, and use action-oriented exercises to implement your own Lean Data survey.
Week 1: The Lean Data Mindset
The goal of this first module is to define Lean Data and understand how this approach to impact measurement fits into the broader spectrum of social impact analysis techniques.
It also illustrates the need for human-centered data collection in the social sector and helps you define your customer promise.
Teams formulate the scope of a Lean Data project using an exercise to clarify customer promise and mission. Through this process teams come to better understand how data plays a role in their ability to deliver on a customer promise.
AS EXAMPLE, LET’S LOOK AT A TEAM WHO TOOK PART IN 2018. TEAM MEMBERS WERE FROM PIKILILY, A TANZANIAN SOCIAL ENTERPRISE THAT PROVIDES MOTORCYCLE SAFETY TRAINING AND REPAIR.
Pikilily trains local women to ride and maintain ‘eRanger’ motorcycle ambulances which provide mothers struggling with childbirth with reliable transportation to hospitals for care.
The Pikilily team’s goal for their Lean Data project was to confirm if their ambulance service was consistent in serving the rural poor. When scoping the project, they determined that if their Lean Data efforts showed less than 80% of their users were rural poor, then they would need to take steps to better understand the barriers to their target beneficiaries using the service. If it returned data to show more than 80% of their users were rural poor, then they would be confident they were reaching their target beneficiaries.

Week 2: Embedding Lean Data in Your Customer Journey
In week 2, teams move from a high level view of Lean Data into the specific steps of the lean data process.
They learn when and how to use lean data as well as how to create customer journey maps. These maps help to visualize all the points of interaction along the customer experience and identify when and where it might make sense to collect data.
Returning to the team evaluating the reach of ambulance services in rural Tanzania, you can see their customer journey map pictured below. The red dots indicate where data is already being collected and the green dots indicate where there are good opportunities for additional data collection.
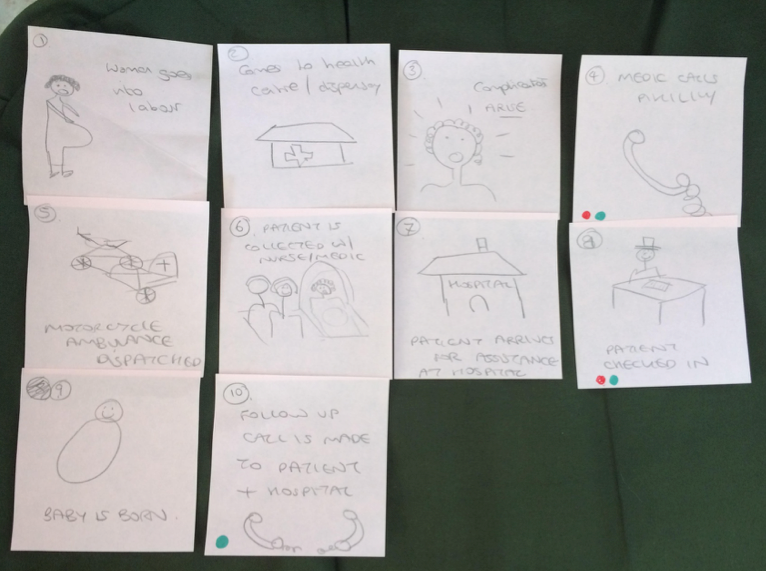
Pikilily’s Customer Journey Map
Week 3: Building Your Lean Data Survey
The goal of this module is to guide teams through the creation of a Lean Data survey, including how to design the questions and format effectively.
After all, the quality and applicability of the data collected will only be as good as the design of the survey itself.
For the step, the Pikilily team formulated 10 survey questions to start. The questions addressed a range of topics, including how people first heard about the service, why they needed it, and any challenges or frustrations they encountered while using it.
The team also formulated the key question that would address their primary objective for the Lean Data project: to understand the level of poverty experienced by the families using their service. Instead of asking specifically about monthly income figures, the team chose to ask about the main source of family income, as these answers would provide more information while still being indicative of the families’ standard of living.
Week 4: Pick Your Technology
From here, teams will become familiar with the various technologies available for Lean Data surveys and learn how to determine whether a technology meets the needs and habits of an audience.
Based on this discovery, teams will select the right technology for their specific survey topic and audience.
After narrowing down the options for survey formats to SMS technology, Pikilily selected a cellular provider that offered the service in Tanzania at a reasonable price point and set up a campaign to reach out to past ambulance users.
With the technology selected, and a clear understanding of the specific information that would best answer their big question about how well they were reaching the rural poor, they were ready to implement their Lean Data survey.
Week 5: Implement, Embed, and Share
Finally, putting it all together: with the challenge at hand focused, and questions and technology selected, this module covers what teams need to know in order to put the plan into action.
Teams learn about collecting data, including tips for training lean data researchers to help. The final step is to learn to quickly synthesize and analyze the collected data for insights that will guide next steps.
Despite some phone numbers in the pool of targeted respondents being incorrect or obsolete, Pikilily still received over 50% response rate to their survey. From those respondents, over 95% confirmed their main source of household income was either subsistence farming, domestic work, or a small shop.
This was the information the team needed to be able to confirm their service was reaching the rural poor as intended. Their next steps would be to continue using SMS surveys to gain a better understanding of how well their service delivers on their mission and customer promise.
Here’s what the Pikilily team had to say at the end of the course:
“It is exciting that I now have all the tools at my disposal (even with zero budget) to get started! Will definitely be using them a great deal more as a core part of our activities. Thank you so much for making this course available and accessible in this way!”
Since completing the course, the Pikilily team reports that the experience has opened the door for new opportunities to put Lean Data into action. Armed with the Lean Data skills and mindset, they now have a better idea of how to simply and quickly collect the hard data needed to give potential funders credible and firm responses to tough questions relating to impact.
Notes About the Course Format
We recommend students join in teams of two to six in order to have the richest course experience. We strongly recommend that course participants find a group of coworkers or friends that they can take the course with in person. You can also connect with others in your local area by posting on the course discussion forums which open one month before the course starts.
Over the five weeks, individuals are free to go through the module readings, videos and real-life case studies at their own pace (roughly 1-hour per week). Then, you’ll meet with your team to go through the workbook exercises (expecting another 2-hours per week to workshop group exercises and assignments).
Course participants who submit four of the five assignments (including the final summary deck) plus the team formation assignment, will earn a Statement of Accomplishment for taking part.
Try it Out Yourself!
If you’ve been looking for resource-efficient ways to gather and analyze data from your customers, this course will help you learn to leverage technology so you can affordably collect high quality data on social performance, customer feedback, and customer behavior.
Sign up for the next cohort of Acumen Academy's Lean Data Approaches to Measure Social Impact today!

Author
Danielle Sutton
Danielle Sutton is the Content Animator at Acumen where she surfaces stories to inspire and activate social entrepreneurs. In an age of information overload, she believes in learning 'the right thing at the right time' to intentionally design impactful social enterprises. You can usually find Danielle digging into the Acumen course library, playing in the mountains, or exploring marketing on The Sedge blog.